Week notes 20/01/2023
The rain has dominated the news for the last couple of weeks, so it feels only appropriate to write about it in our weeknotes too.
When heavy rain is in the news we see a surge of traffic on our website. People want to:
- check flood warnings
- check river levels
- check their flood risk
- sign up for flood alerts (or cancel them)
This was the news on 12 January 2023: ‘Flooding: Businesses, homes and transport hit after torrential rain across Wales’. And a picture of a car submerged in flood water.
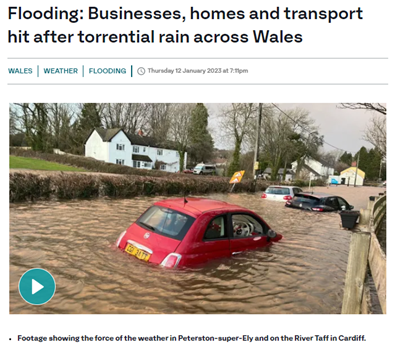
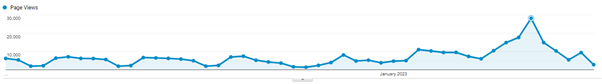
On the same day we had over 28,000 views on our website. For comparison, on a normal day we get about 5-6000 views. Naturally, the increase in users means we get more feedback and we can’t help poking around to see what the analytics is showing us.
Check your flood risk by postcode
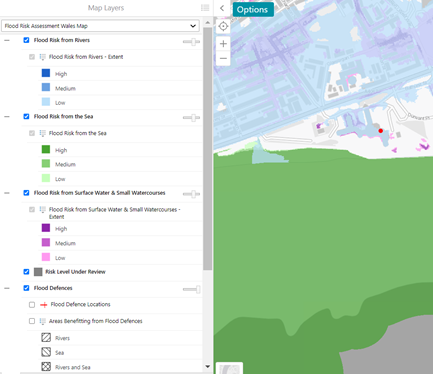
In 2021 we re-designed the ‘Check your flood risk by postcode’ service in response to feedback and user testing. People were struggling to use our maps and understand their flood risk.
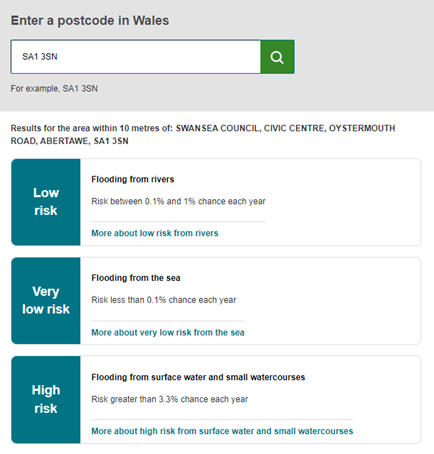
Users can now simply enter their postcode and it tells them the flood risk for their area. This meets the user needs of most users. We know this because we received over 1000 responses to a pop-up survey on the old flood risk maps page.
This showed that 9 out of 10 users:
- were not flood risk professionals
- used the map to check a single address, usually a property they were considering buying
- did not need to see areas at scale
- did not need a map-based risk result
It’s great to see that this service now gets around four times the views of our flood maps. Between 16 January 2022 and 16 January 2023 the service received over 532,000 views.
Before:
After:
Understanding flood risk results
But not all flood pages get a lot of views….even in the rain!
The page that helps people understand what the results for their area mean, ‘Understanding your flood risk results’ only had 1,390 views in the same period. 0.26% of the total figure for ‘Check your flood risk by postcode’.
In a sample of 3,500 views, only 45 clicked on the ‘Understanding your flood risk results’ link, versus 1,152 for the ‘View flood risk for this area on a map’ link:
For many users the ‘Check your flood risk by postcode’ service gives people an unambiguous answer - they don’t need to delve further.
This is supported by the lack of feedback we get compared to the regular negative feedback we used to get about the flood maps.
User needs vs NRW needs
In recent feedback users have asked why an area has no record of flooding when they know it has. This is because their properties were flooded by surface water. This is the responsibility of local authorities, not NRW (confusing!).
We know that splitting flood responsibilities in this way isn’t user-centric. Frazer Rhodes has blogged about this issue.
But we’ve introduced our own confusion here. When redesigning the service, subject matter experts asked us to include the ‘history of recorded flooding’ on the risk results page. This was to reduce the amount of time the customer hub and flood risk team spent processing ‘insurance related requests’.
This is attracting users to look at the wrong risk indicator. The high/low/medium risk results for an area are based on computer modelling. The ‘recorded flooding’ isn’t. We may have no records for an area or the records may be unreliable.
User testing showed that some people think flood risk means that an area had flooded in the past. This crops us regularly in our website feedback. We can see below that by exposing ‘recorded flooding’, we’re inviting users to question their high/medium/low risk result. We’re also making users lose confidence in NRW’s information, as well as feel angry and frustrated:
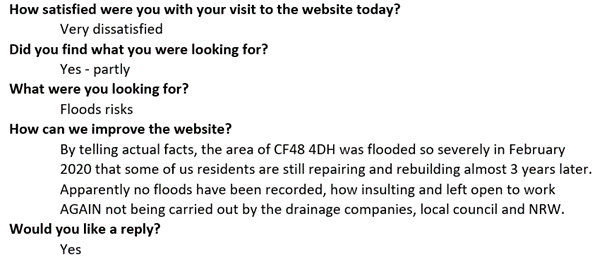
The explanation about what ‘recorded flooding’ means is buried in the ‘Understanding your flood risk result’ page: a link that most users ignore.
Ordinarily, we could act on this user feedback by explaining what ‘recorded flooding’ means on the risk results page. But we can’t iterate to improve the front-end because the service isn’t in Umbraco.
It’s not just flood
We’re seeing similar trends/issues across the organisation. We’re hoping that we can keep using analytics and user research insights like this to demonstrate how some of our services aren’t working in the way we intended.
Some other stuff we’re doing
-
Lucinda added some headings and reordered the research and reports landing page to make it easier to use
-
Sam noticed lots of people were contacting us to cancel their flood details so she added a link to the general enquiries page
-
Shaun is continuing to work on the charging consultation
-
Sophie has put the corporate plan in test to get a feel for how this could look once it has been finalised
-
Laura, Sam and Lucinda are continuing their work to explore the issues with permissions
-
Heledd met with Smart Survey and is looking at options to upgrade some of the features
-
Phil has started the next phase of the forestry project to look at the managing your woodland, licences and permits
-
Laura and Lucinda have been working on updating the ‘flood risk activity permit’ application form to make it work better for agents / consultants who are completing the form on behalf of someone else
-
James is holder user research interviews about SoNaRR
-
Defra launched their Welsh language ‘Get a fishing licence’ service. James and Manon from the Translations Team helped Defra to make sure this service worked as smoothly in the Welsh as the English. We’ve had some great feedback already from users.